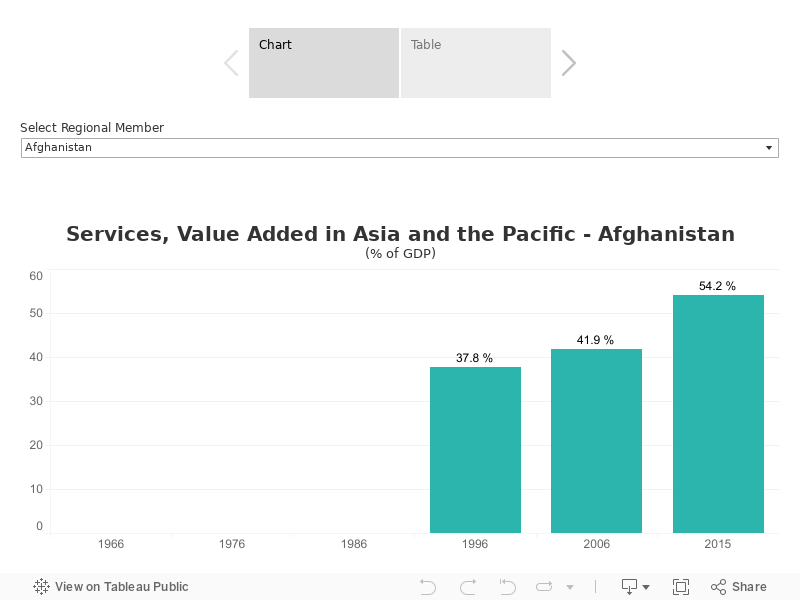
Services, Value Added (% of GDP) in Asia and the Pacific
Services, Value Added (% of GDP) values by regional member and subregion. This dataset shows the pattern of growth per decade from 1966 to 2016.
Data and Resources
| Field | Value |
|---|---|
| Last Updated | |
| Publish Date | |
| Update Frequency | One-time |
| Available Formats | |
| Temporal Coverage | - |
| Language | English (United States) |
| License | All Rights Reserved |
| Granularity |
|
| Access Level | Public |
| Countries/Economies |
|
| Region | |
| Topics | |
| Tags |